 Work Quest Hub
UX Designer vs Graphic Designer: Which Pays More?
The 2025 federal wage data puts digital and UX design ahead, but both roles ask for the same degree and the local gap can be much narrower.

By Desmond OkaforNov 15, 2026 · 8 min read
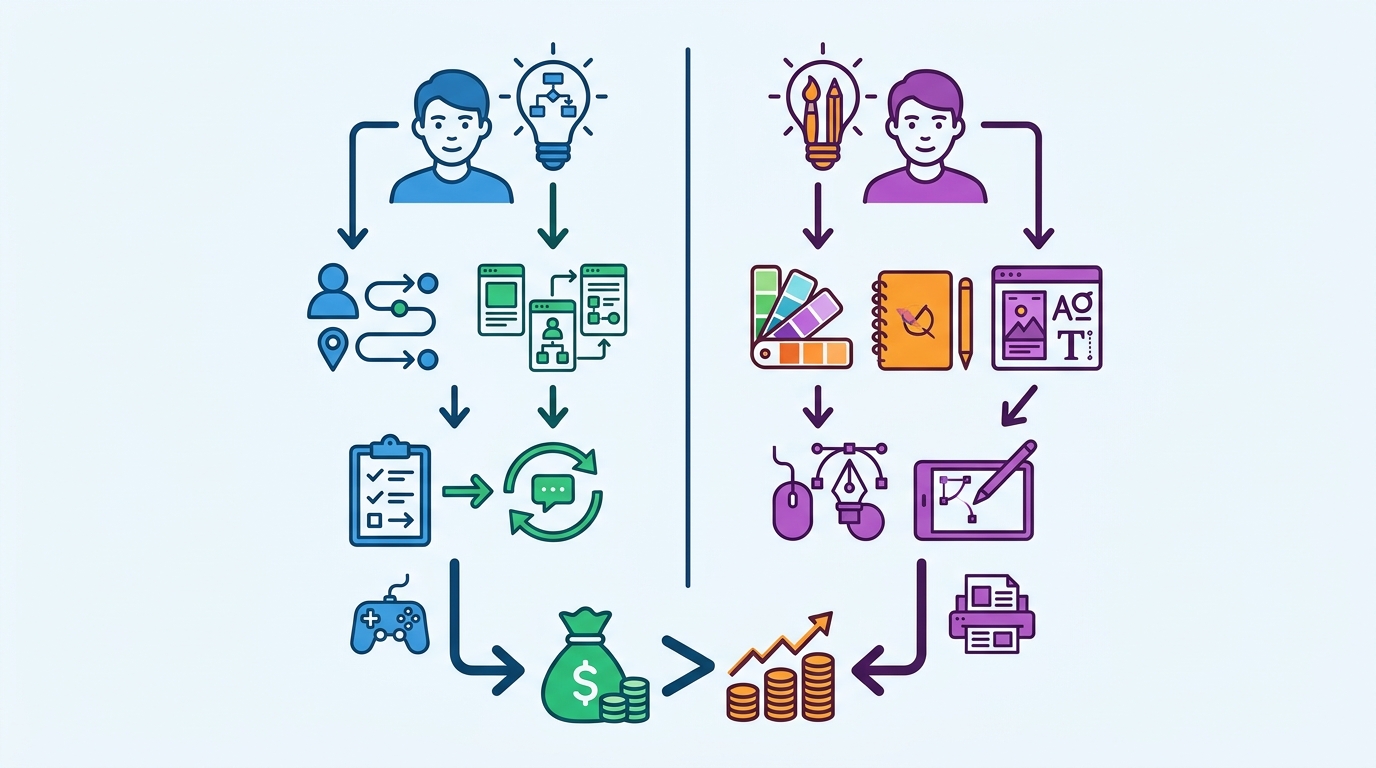
On national figures, UX work pays more. The U.S. Bureau of Labor Statistics groups most UX and interface design work under Web Developers and Digital Designers, which had a 2025 median of $99,520 per year and $47.85 per hour, against $62,960 per year and $30.27 per hour for Graphic Designers (U.S. Bureau of Labor Statistics, 2025).
Those are medians, not floors or ceilings. Half of each group earns less, and BLS publishes separate state and metro estimates, so check your own area before treating the national number as what you would be offered.
Side-by-Side Pay Comparison
Both pay figures below are medians, meaning half of workers in the occupation earned more and half earned less. They are wage and salary figures.
| Measure | UX / digital design (Web Developers and Digital Designers) | Graphic Designer |
|---|---|---|
| Median annual pay, 2025 | $99,520 (U.S. Bureau of Labor Statistics, 2025) | $62,960 (U.S. Bureau of Labor Statistics, 2025) |
| Median hourly pay, 2025 | $47.85 (U.S. Bureau of Labor Statistics, 2025) | $30.27 (U.S. Bureau of Labor Statistics, 2025) |
| Second source, median annual | $104,000 for Web and Digital Interface Designers (National Center for O*NET Development, 2025) | none published under a separate code |
| Second source, median hourly | $50.00 (National Center for O*NET Development, 2025) | none published under a separate code |
| Bonus included in the published median | none — the $99,520 figure is a wage figure (U.S. Bureau of Labor Statistics, 2025) | none — the $62,960 figure is a wage figure (U.S. Bureau of Labor Statistics, 2025) |
| Overtime included in the published median | none reported separately; $47.85 is the published hourly median (U.S. Bureau of Labor Statistics, 2025) | none reported separately; $30.27 is the published hourly median (U.S. Bureau of Labor Statistics, 2025) |
| Typical entry-level education | Bachelor's degree, no prior related work experience and no on-the-job training listed (U.S. Bureau of Labor Statistics, 2025) | Bachelor's degree, no prior related work experience and no on-the-job training listed (U.S. Bureau of Labor Statistics, 2025) |
| Projected change, 2025–35 | +5%, an increase of 11,300 jobs (U.S. Bureau of Labor Statistics, 2025) | −2%, a decrease of 4,200 jobs (U.S. Bureau of Labor Statistics, 2025) |
Why the Gap Exists
The difference between $99,520 and $62,960 a year is not a credential gap. BLS lists the same typical entry-level education for both — a bachelor's degree, with no related work experience and no on-the-job training required (U.S. Bureau of Labor Statistics, 2025). Neither role carries a licence or a state registration you must hold to practise, so there is no exam that closes the distance.
The first structural factor is where the jobs sit. Some web developers and digital designers work in the computer systems design and related services industry, and others are self-employed (U.S. Bureau of Labor Statistics, 2025). Design work priced inside software and technology services is budgeted against engineering work, which is the environment that supports the $47.85 hourly median. Graphic design work is more often attached to advertising, publishing, printing and in-house marketing teams, and the $30.27 hourly median reflects that setting.
The second is the direction of demand. Employment in web development and digital design is projected to grow 5% from 2025 to 2035, adding 11,300 jobs, while graphic design is projected to fall 2%, a loss of 4,200 jobs (U.S. Bureau of Labor Statistics, 2025). A growing occupation gives candidates leverage at offer stage; a shrinking one does the opposite. ONET projects 8,300 openings for Web and Digital Interface Designers over the same decade (National Center for ONET Development, 2025).
The third is how the work is scoped. Digital designers in this occupation develop, create and test website or interface layout, functions and navigation for usability (U.S. Bureau of Labor Statistics, 2025) — testing and measurement that employers tie to product outcomes. That is part of why the narrower Web and Digital Interface Designers code reports a 2025 median of $104,000 a year and $50.00 an hour (National Center for O*NET Development, 2025), above the broader $99,520 annual median.
Neither occupation is paid on union scale or a published shift premium, so bonus and overtime arrangements are set employer by employer and sit outside the medians above.
One caution on job titles. UX designers are not counted separately by BLS; they are folded into Web Developers and Digital Designers. If a job advertised as UX is really production artwork, the pay may track closer to the $62,960 graphic design median than to $99,520.
Where Each Role Pays Best
The medians below are national. BLS and O*NET both publish state and metro breakdowns, and those are the figures to pull before you negotiate a local offer.
| Role | National median, 2025 | Where to pull local figures | States and metros worth checking first |
|---|---|---|---|
| Web Developers and Digital Designers (covers UX and digital interface work) | $99,520 annual, $47.85 hourly (U.S. Bureau of Labor Statistics, 2025) | BLS Occupational Employment and Wage Statistics, state and metro tables | California, Washington, New York, Massachusetts, Texas |
| Web and Digital Interface Designers (narrower code, SOC 15-1255.00) | $104,000 annual, $50.00 hourly (National Center for O*NET Development, 2025) | O*NET state wage pages for SOC 15-1255.00 | Your own state, plus the state you would relocate to |
| Graphic Designers | $62,960 annual, $30.27 hourly (U.S. Bureau of Labor Statistics, 2025) | BLS Occupational Employment and Wage Statistics, state and metro tables | California, New York, Illinois, Georgia, Minnesota |
How to spot a reversal: open the same state or metro table for both occupation codes and read the two annual medians side by side. Nationally the order favours digital design, $99,520 against $62,960 (U.S. Bureau of Labor Statistics, 2025), but state medians are estimated independently. In metros where publishing, packaging or advertising employ a large share of graphic designers and digital design employment is thin, the local gap can be far smaller than the national one, or run the other way. Trust the state figure over the national figure when an offer is on the table.
Which Path Fits You
- You want the higher median outright. Digital and UX design, at $99,520 a year (U.S. Bureau of Labor Statistics, 2025), sits above graphic design's $62,960 annual median (U.S. Bureau of Labor Statistics, 2025).
- You want entry without extra credentials. Either path works. Both list a bachelor's degree and no required prior experience or on-the-job training (U.S. Bureau of Labor Statistics, 2025), so the pay difference is not gated behind a licence.
- You want the occupation that is growing. Digital design is projected up 5% to 2035, adding 11,300 jobs; graphic design is projected down 2%, losing 4,200 jobs (U.S. Bureau of Labor Statistics, 2025).
- You expect to bill hourly or contract. The published 2025 hourly medians are $47.85 for digital design and $30.27 for graphic design (U.S. Bureau of Labor Statistics, 2025), so your starting rate anchor differs from the first invoice.
- You prefer self-directed work. Some web developers and digital designers are self-employed (U.S. Bureau of Labor Statistics, 2025), and that route starts from the $47.85 hourly median rather than $30.27.
- You are already a graphic designer. Moving toward layout, navigation and usability testing work (U.S. Bureau of Labor Statistics, 2025) points you at the code reporting a $104,000 annual median (National Center for O*NET Development, 2025), without a new degree.
Frequently asked questions
Is the UX pay advantage the same everywhere in the US?
No. The comparison of $99,520 against $62,960 a year (U.S. Bureau of Labor Statistics, 2025) is a national median comparison. BLS publishes separate state and metro medians for both occupations, and those local estimates can sit above or below the national figures, so pull your own state's table before assuming the order holds.
Why do I see two different UX medians?
Two occupation codes cover the work. BLS reports $99,520 a year and $47.85 an hour for Web Developers and Digital Designers (U.S. Bureau of Labor Statistics, 2025), while O*NET reports $104,000 a year and $50.00 an hour for the narrower Web and Digital Interface Designers code (National Center for O*NET Development, 2025), which leaves out general web development roles.
Do bonuses or overtime close the gap?
No bonus or overtime amount is built into either published median — the $99,520 and $62,960 annual figures are wage and salary figures (U.S. Bureau of Labor Statistics, 2025). Any bonus or overtime arrangement is set by the individual employer, so ask for it in writing at offer stage rather than assuming it exists.
Does graphic design still make sense at the lower median?
It can. Half of graphic designers earn more than the $62,960 annual median (U.S. Bureau of Labor Statistics, 2025), and the stated entry requirement is the same bachelor's degree with no prior experience listed (U.S. Bureau of Labor Statistics, 2025). The warning sign is direction: the occupation is projected to shrink 2% by 2035, a loss of 4,200 jobs, against 5% growth and 11,300 added jobs in digital design (U.S. Bureau of Labor Statistics, 2025).
Sources
- U.S. Bureau of Labor Statistics — Web Developers and Digital Designers : Occupational Outlook Handbook (2025)
- U.S. Bureau of Labor Statistics — Graphic Designers : Occupational Outlook Handbook (2025)
Your coach for this guide
Desmond covers workplace culture and the unwritten rules that shape who gets ahead. He likes talking to people mid-career, after the certainty has worn off and the real questions start.